
Field manual · 09/17
Terrain Analysis
Terrain analysis answers the questions a contour map makes you work out for yourself: what can be seen from here, whether those two points can see each other, how steep that slope is, and how high the ground is. Most of it runs on-device and works offline once the elevation data is downloaded.
where the elevation comes from
Everything in this chapter runs on a digital elevation model. Resolution depends on where you are: 1 arc-second (about 30 m) across North America, Europe, Japan and New Zealand, and 3 arc-second (about 90 m) elsewhere.
viewshed
Shades everything visible from the map centre against everything hidden from it — the fastest way to find dead ground, site an observation post, or work out where you can be seen from.
- Put the map centre on the observer's position.
- Open Tools → Viewshed and set the Radius — a slider from 0.5 km upwards, in 0.5 km steps.
- Read the shading: visible terrain against terrain in defilade.
line of sight
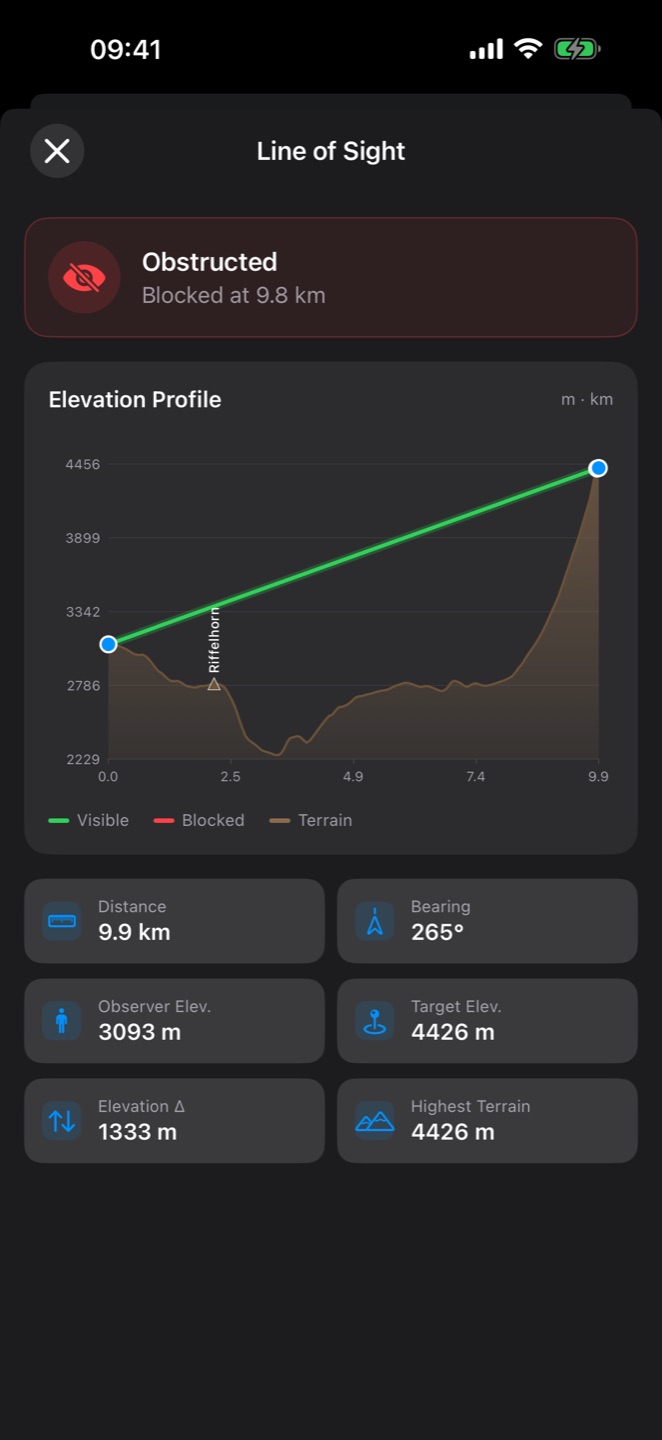
Two points, one question: can they see each other? Place an observer and a target and the tool returns a verdict plus the numbers behind it.
- Distance
- Ground distance between the two points
- Slant Range
- True line-of-sight distance, including height difference
- Bearing
- Observer to target, in your north reference
- Vertical Angle
- Angle of elevation or depression to the target
- Observer Elev.
- Ground height under the observer
- Target Elev.
- Ground height under the target
- Elevation Δ
- Height difference
- Highest Terrain
- The highest ground along the path
slope PRO

Slope Angle
Shades the visible terrain by steepness, highlighting 27° and above — the threshold that matters for avalanche awareness and for vehicle go/no-go. It covers the visible map area up to about 40 km across and tells you the current coverage as you zoom.
Slope Between Points
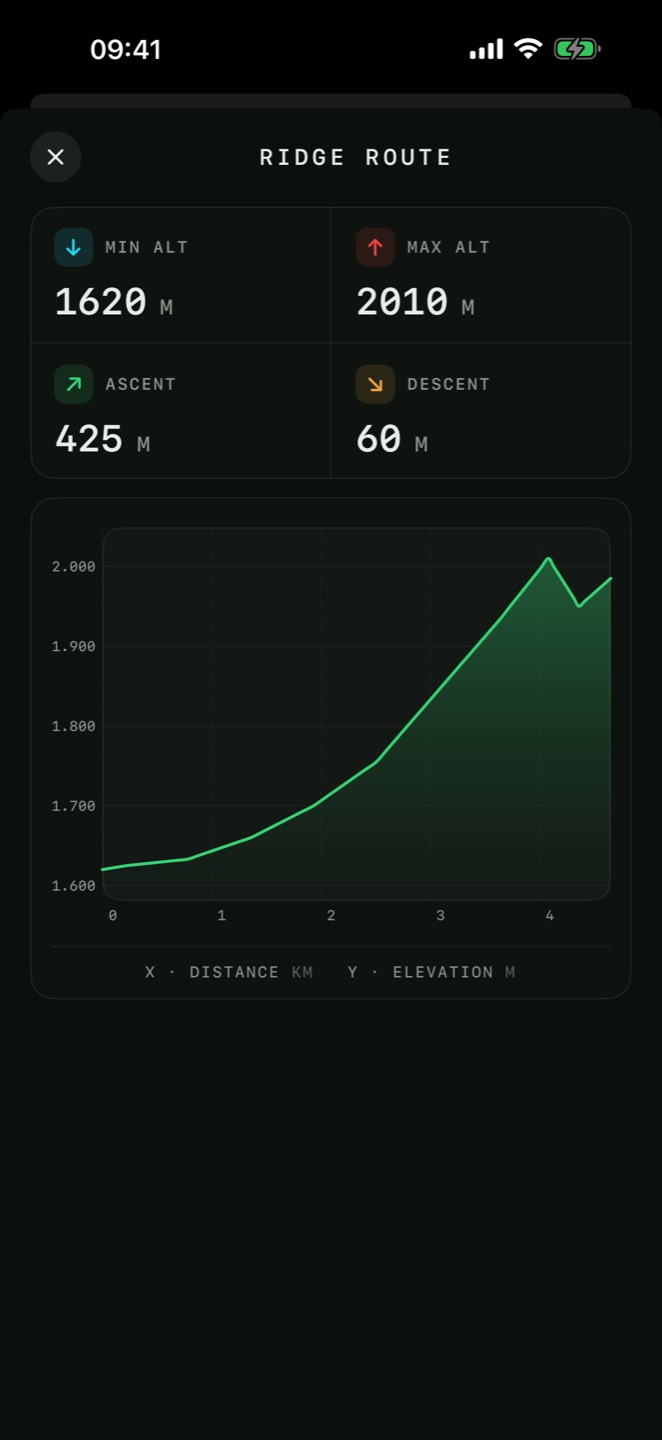
Draw a path and get the inclination leg by leg: Total Length, Total Ascent, Total Descent, Average Incline, the Steepest Leg with its number, and a slope profile. Save Path to Layer keeps the result.
contour lines PRO
Draws elevation contours over any base map, satellite imagery included — so you can have imagery and terrain shape at once instead of choosing between them.
elevation and sea depth PRO
Elevation
Ground height at the map centre, with Incline and Aspect — how steep the ground is there and which way it faces. Aspect matters for sun, wind, snow and cover.

Sea Depth
Water depth under the map centre, from bathymetric data.
elevation offline
Terrain analysis without a signal needs the elevation data on the device first.
- Open Map Type → Offline Maps → Add Offline Region.
- Box the area and leave Include Terrain Data switched on.
- Download. Contours, viewshed, line of sight, slope and spot elevation then work offline across that box.
ar view PRO
Holds the camera up to the landscape and labels it. Peaks within 50 km are named with their altitude, your own pins are drawn where they really are, and the sun and moon arcs show where the light will be.

Your pins in the landscape
Pins from the active and visible layers within 10 km are projected onto the camera view with their map symbol and live distance, and are never hidden behind terrain — a waypoint behind a ridge still shows you which way it is.

The skyline corrects the compass
The app computes the terrain silhouette for your position and matches it against the real skyline in the camera. Locking the two together corrects compass error, which is what makes the labels sit on the right summits instead of drifting.